
Where is the risk in the 2026/27 cotton crop?
Where the 2026/27 cotton crop is most exposed: Pakistan's wet harvest, Xinjiang's drought, US heat and Brazil's Q1 rain, plus the 12-month price outlook from Helios AI.

October 6, 2026
3 min read
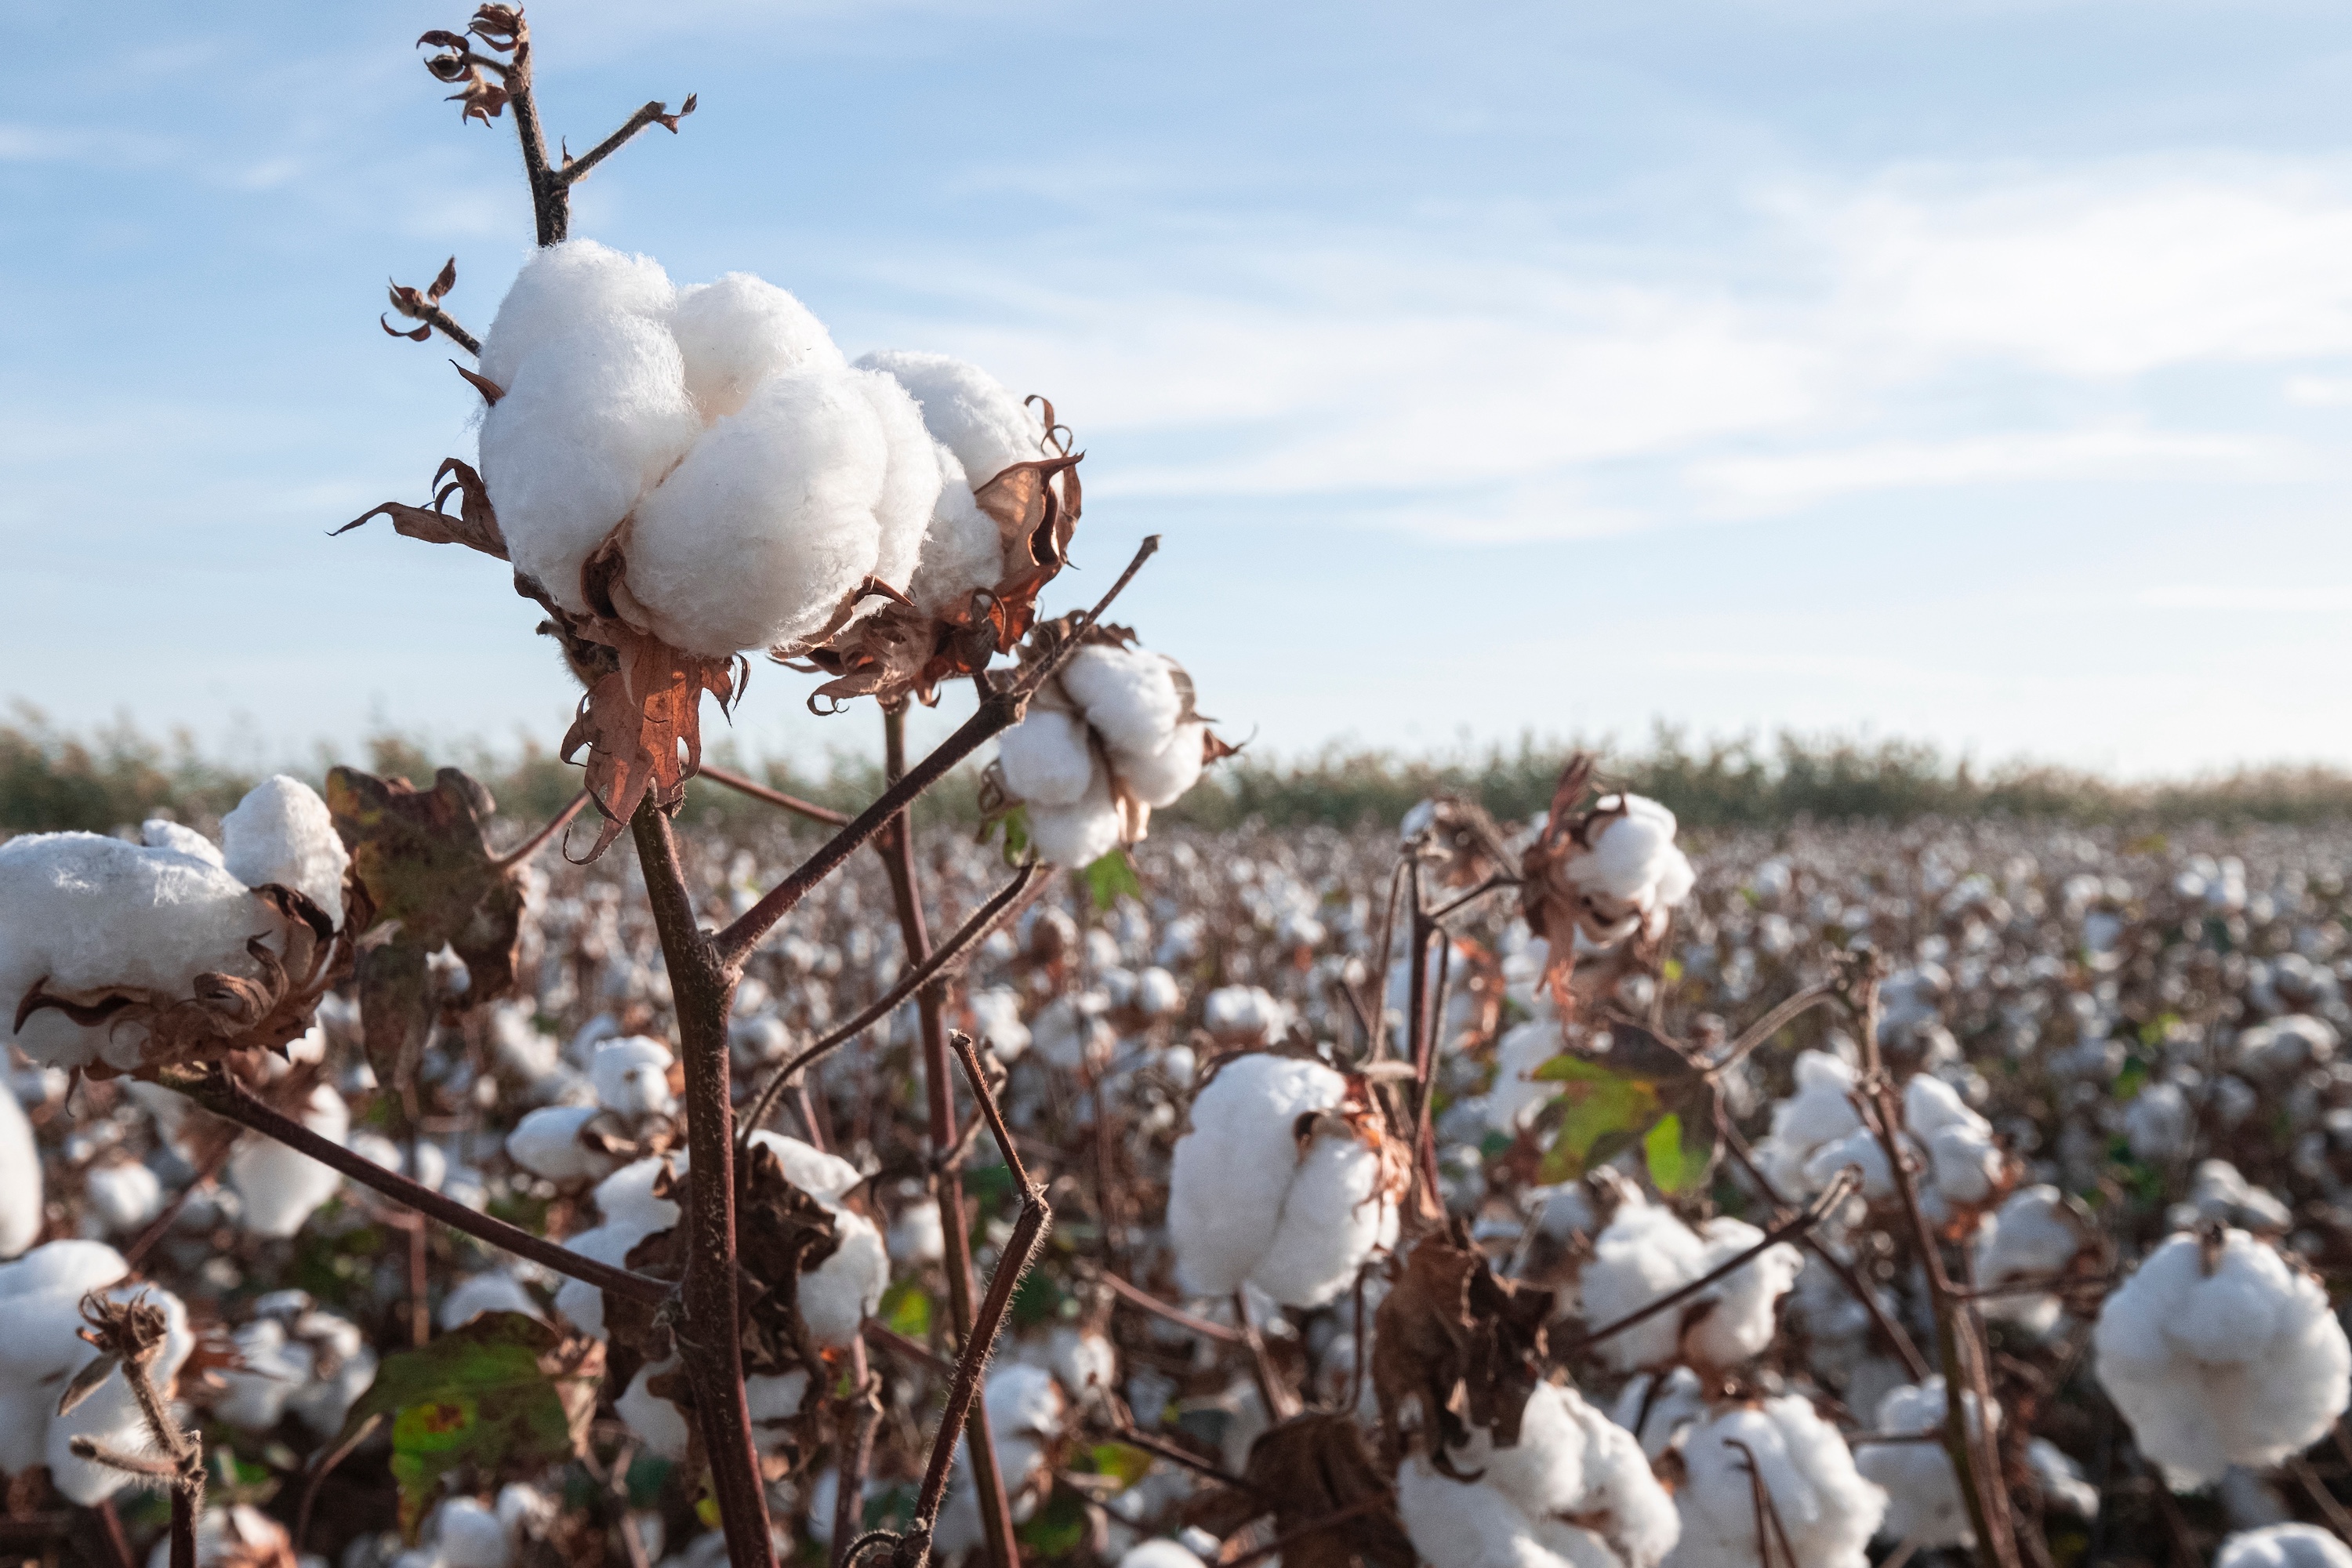
The 2026/27 cotton crop carries its sharpest near-term risk in Pakistan, where the Helios AI weather risk index is forecast to run at more than twice its normal level by mid-November, right as the harvest comes off the field. That is the headline. The fuller picture is that the five countries growing about 85% of the world's cotton are each dealing with a different weather problem this season: too much rain in Pakistan, drought already locked in across India and Xinjiang, record heat in the US harvest, and a wet start to Brazil's 2027 crop still months away.
World Cotton Day falls on 7 October, which makes this a reasonable moment to look at where the fibre comes from, where the risk sits between now and March, and what the Helios Horizon price model expects cotton to do over the next twelve months. The short version is that the model sees a sharp harvest-pressure dip this month, then a recovery driven by the same wet weather flagged below.
Who grows the world's cotton?
China, India, Brazil, the United States and Pakistan grow about 85% of the world's cotton between them, and the same five ranked in the same order in the 2024/25 actuals. Helios Horizon tracks the crop as seed cotton, unginned, so the tonnages below will not match trade press figures quoted in lint bales. The ranking and the shares hold either way.
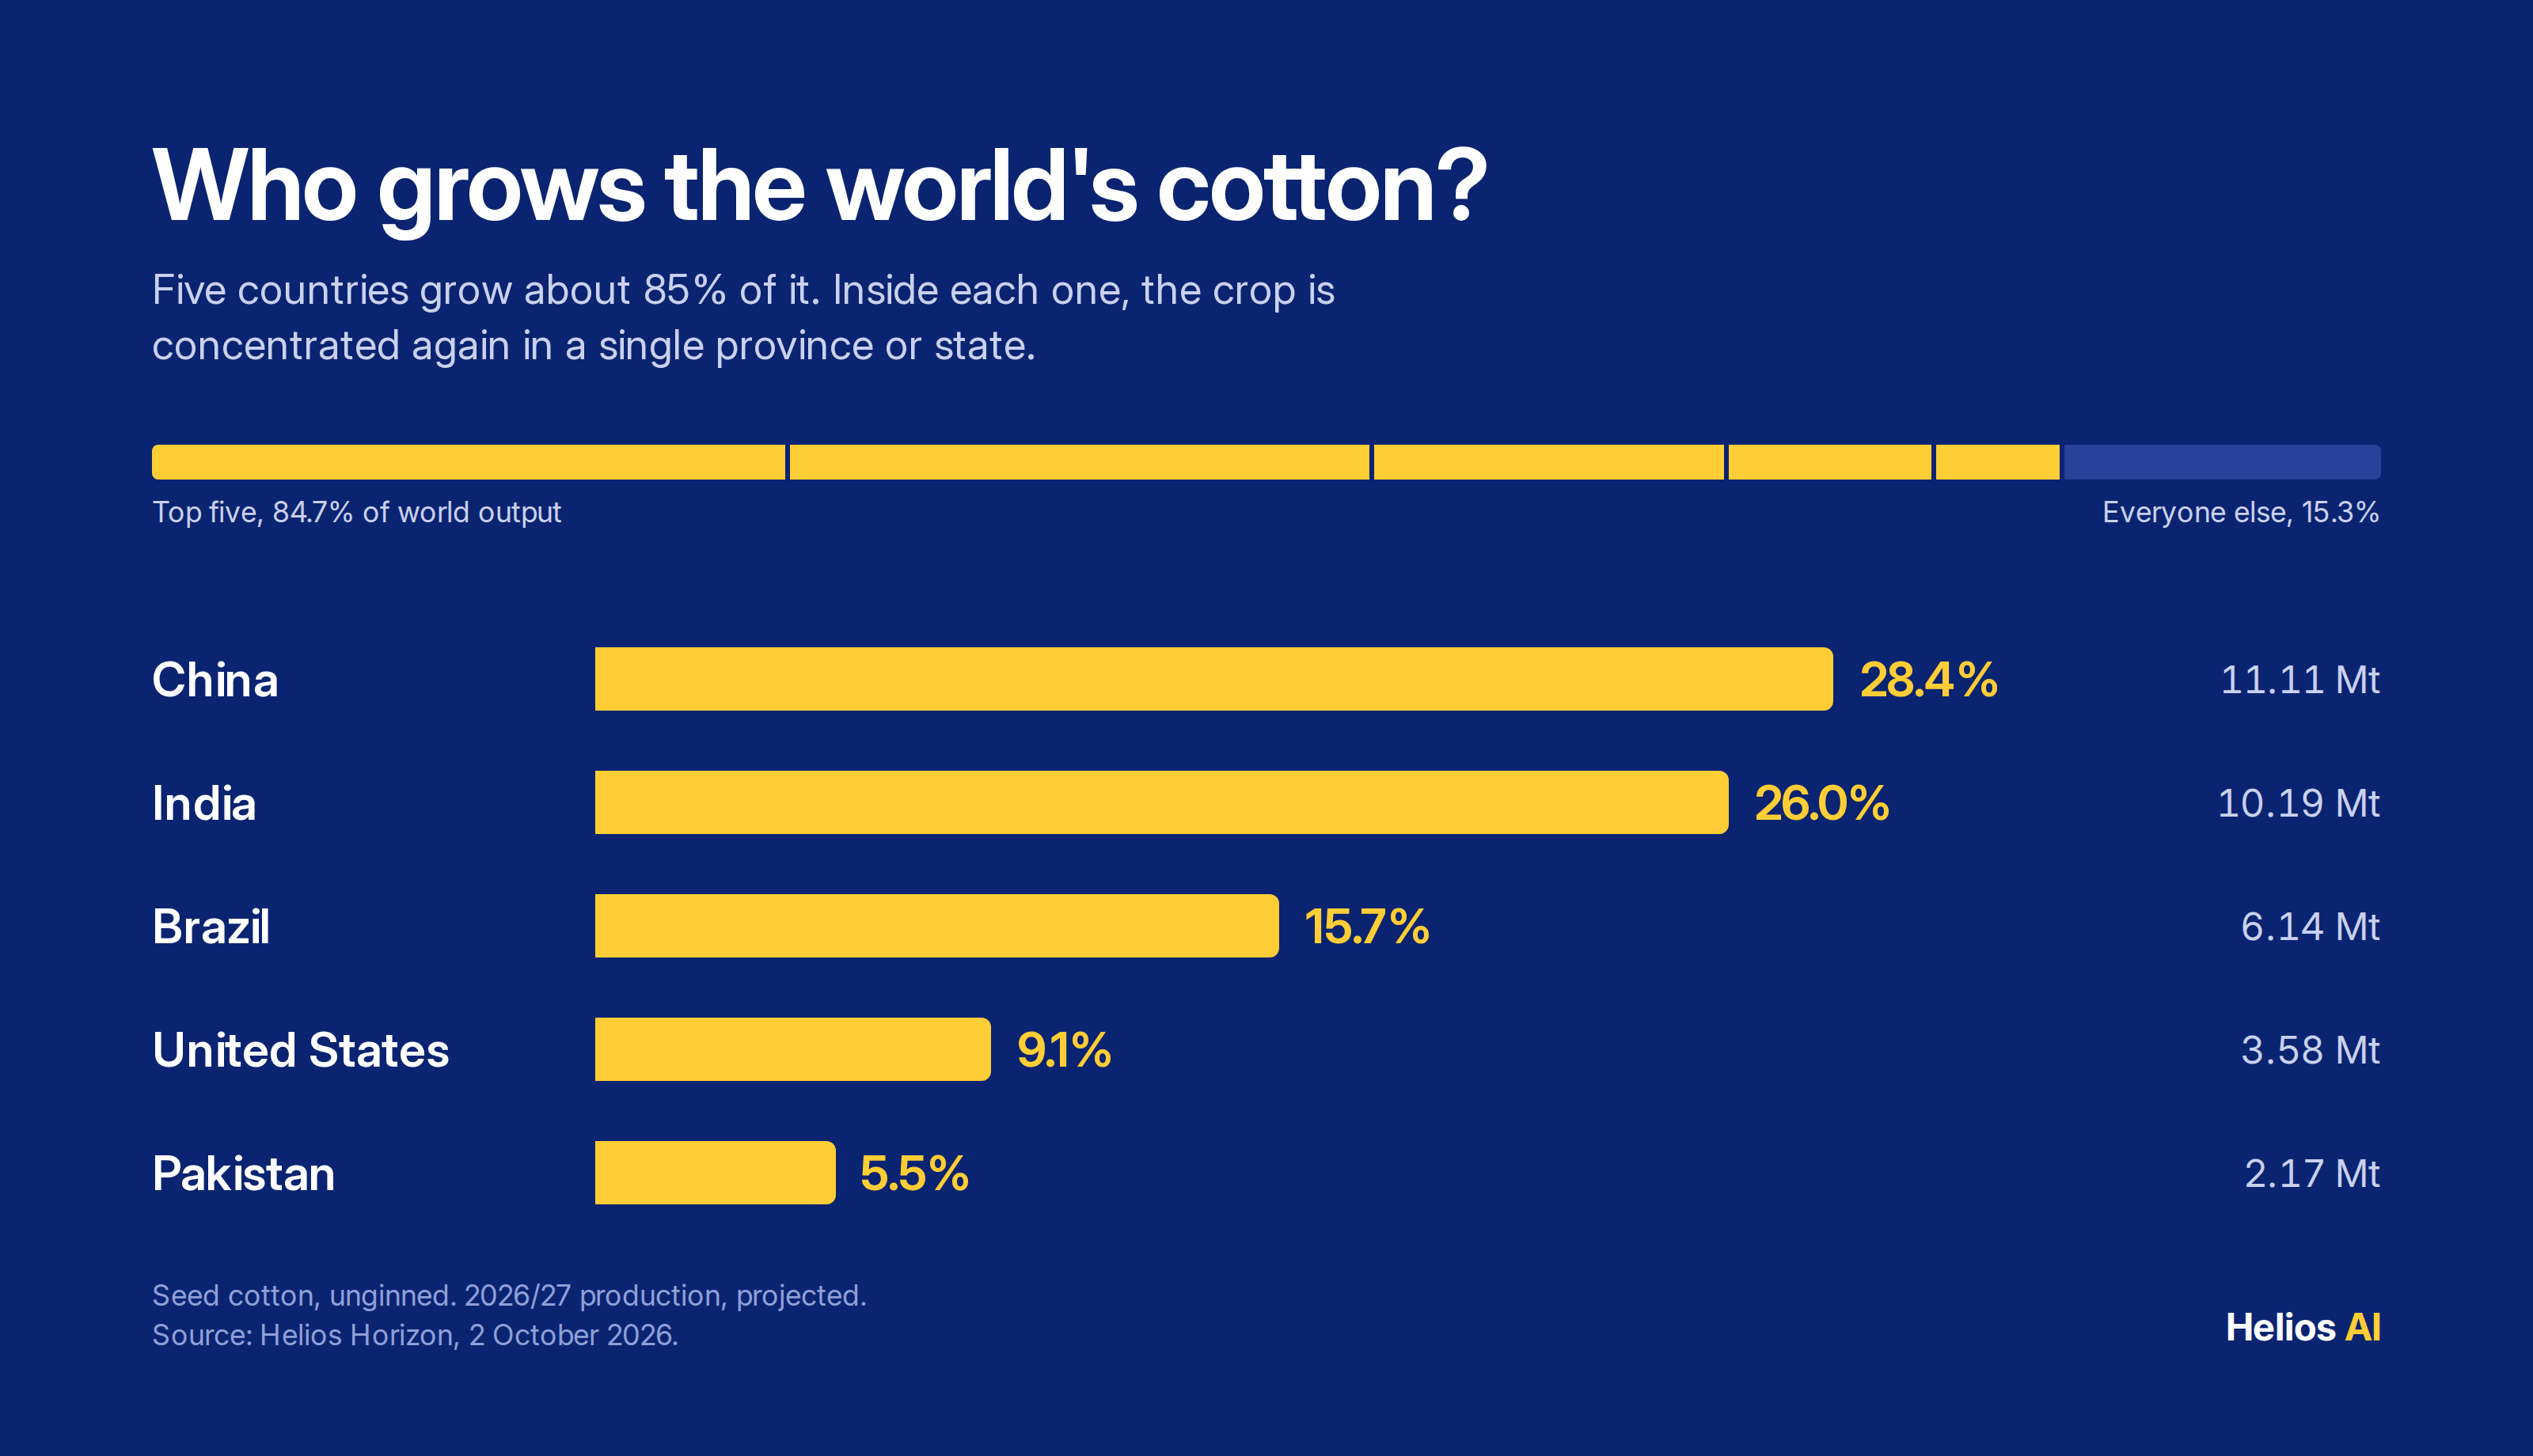

The concentration matters more than the ranking. Within each country the crop is concentrated again: Xinjiang grows 91% of China's cotton, Mato Grosso 70% of Brazil's, Punjab 66% of Pakistan's. A weather problem in one province is a national supply problem within weeks.
Why is Pakistan the biggest cotton risk this quarter?
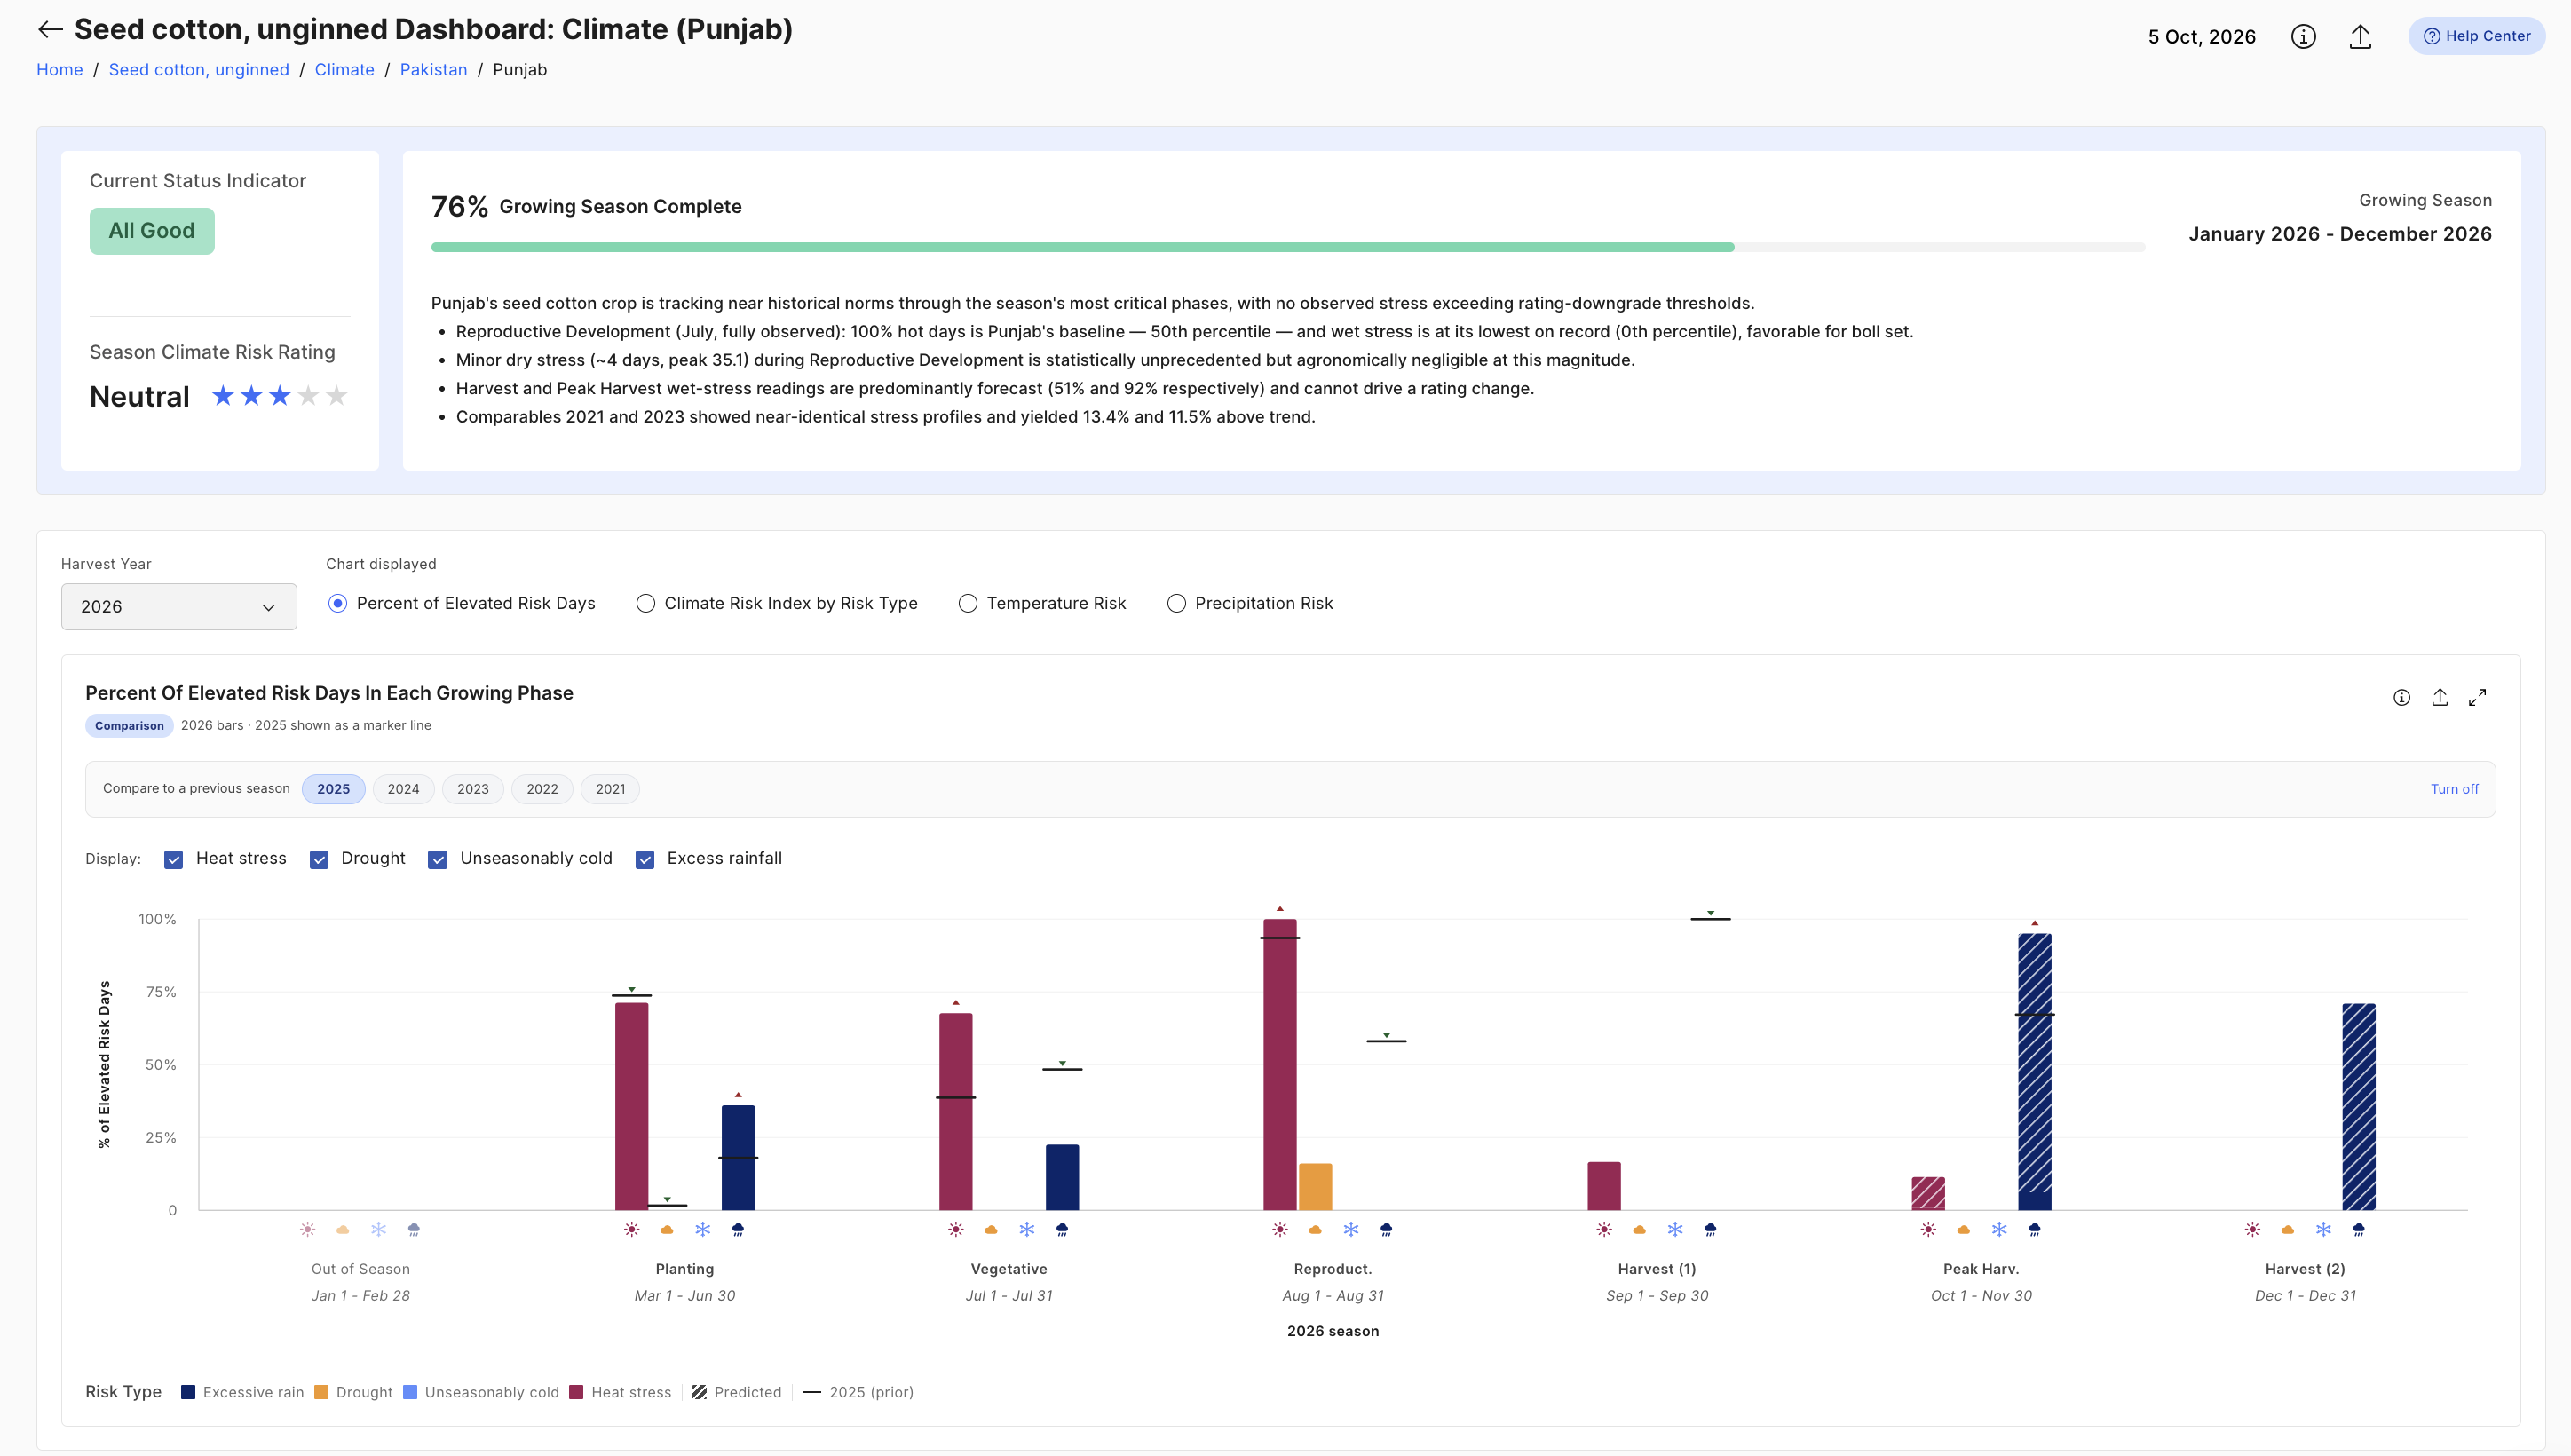
Pakistan is the biggest swing in the dataset because its harvest risk is forecast to climb from well below normal to well above it in six weeks. The country-level weather risk index opened the quarter at 10.4 on 1 October against a historical norm of 23.3 for that date. The forecast then has it rising to a peak of 64.8 on 17 November, roughly 2.3 times the 27.7 norm for that day, before easing to 49.9 by the end of the month. In Horizon's severity bands that is a move from Low to Mid on 6 November and into High from 11 November onward.
Almost all of that risk is rain. On the 17 November peak, 64.2 of the 64.8 index points come from excess wet conditions. The forecast for the peak harvest window in October and November runs at 95.1% wet days and 57.4% hot days, and the December harvest is forecast at 87.1% wet days. Punjab, which grows 66% of the crop, and Sindh, with 33%, carry the exposure between them.
The nuance that matters for buyers is that this is not a yield story. Both provinces came through boll set in normal condition and the crop is rated All Good on the platform. What a wet harvest does instead is degrade quality: lint picked wet discolours, picks up trash and gins poorly. The volume may well arrive, but the grade and the ginning timeline are the exposure.
What has already happened to India's cotton crop?
India's damage is already in the ground, and the forecast from here is milder than the rating suggests. The country moved from Watch to Take Action on 5 October, with a one-star Poor rating, but that reflects what happened in September and October. Every day of reproductive development recorded drought stress, a 100th-percentile reading, and grain fill followed with 100% dry days plus heat stress on 42% of days. Maharashtra (25% of output) and Haryana (5%) are at Take Action and Gujarat (20%) has dropped to one star, so about half of India's cotton is under severe observed stress. The forecast for the fourth quarter and the first quarter of 2027 actually runs below the historical average for most of the window.
What the forecast does show is a crop that cannot settle. The country index swings from 24.9 on 29 October to 7.7 on 8 November, back up to 24.3 on 9 December, down to 8.0 on 12 January and then holds near 9 through February. The driver flips along the way, from too dry in October, when 19.5 of the 24.9 points are drought, to wet and cold in December, with 19.2 points from excess wet and 5.9 from cold. The peak harvest window from November to January is forecast at 51% wet days and 47.8% cold days, and Maharashtra's post-harvest period is forecast at 87% hot days. For a crop that has already lost yield to drought, a cold, wet harvest is the wrong follow-up, and the dashboard notes there is no strong historical analog for conditions this severe.
How hot is the US cotton harvest running?
The US peak harvest has recorded heat on 96% of days and drought on 36%, the worst readings in Horizon's eight-season record, and the country sits at Take Action with a two-star Fair rating. Texas, which grows 32.5% of the US crop, saw heat on 61.5% of peak-harvest days and drought on 24.2%, both at the 100th historical percentile, after a planting window that ran hot on 78.3% of days. Texas and Georgia (15.1%) are both at Take Action and Arkansas (13.7%) carries a one-star Warning, so over 60% of national output is under severe stress. December post-harvest conditions are forecast at about 42% hot days, though the harvest outcome is already set.
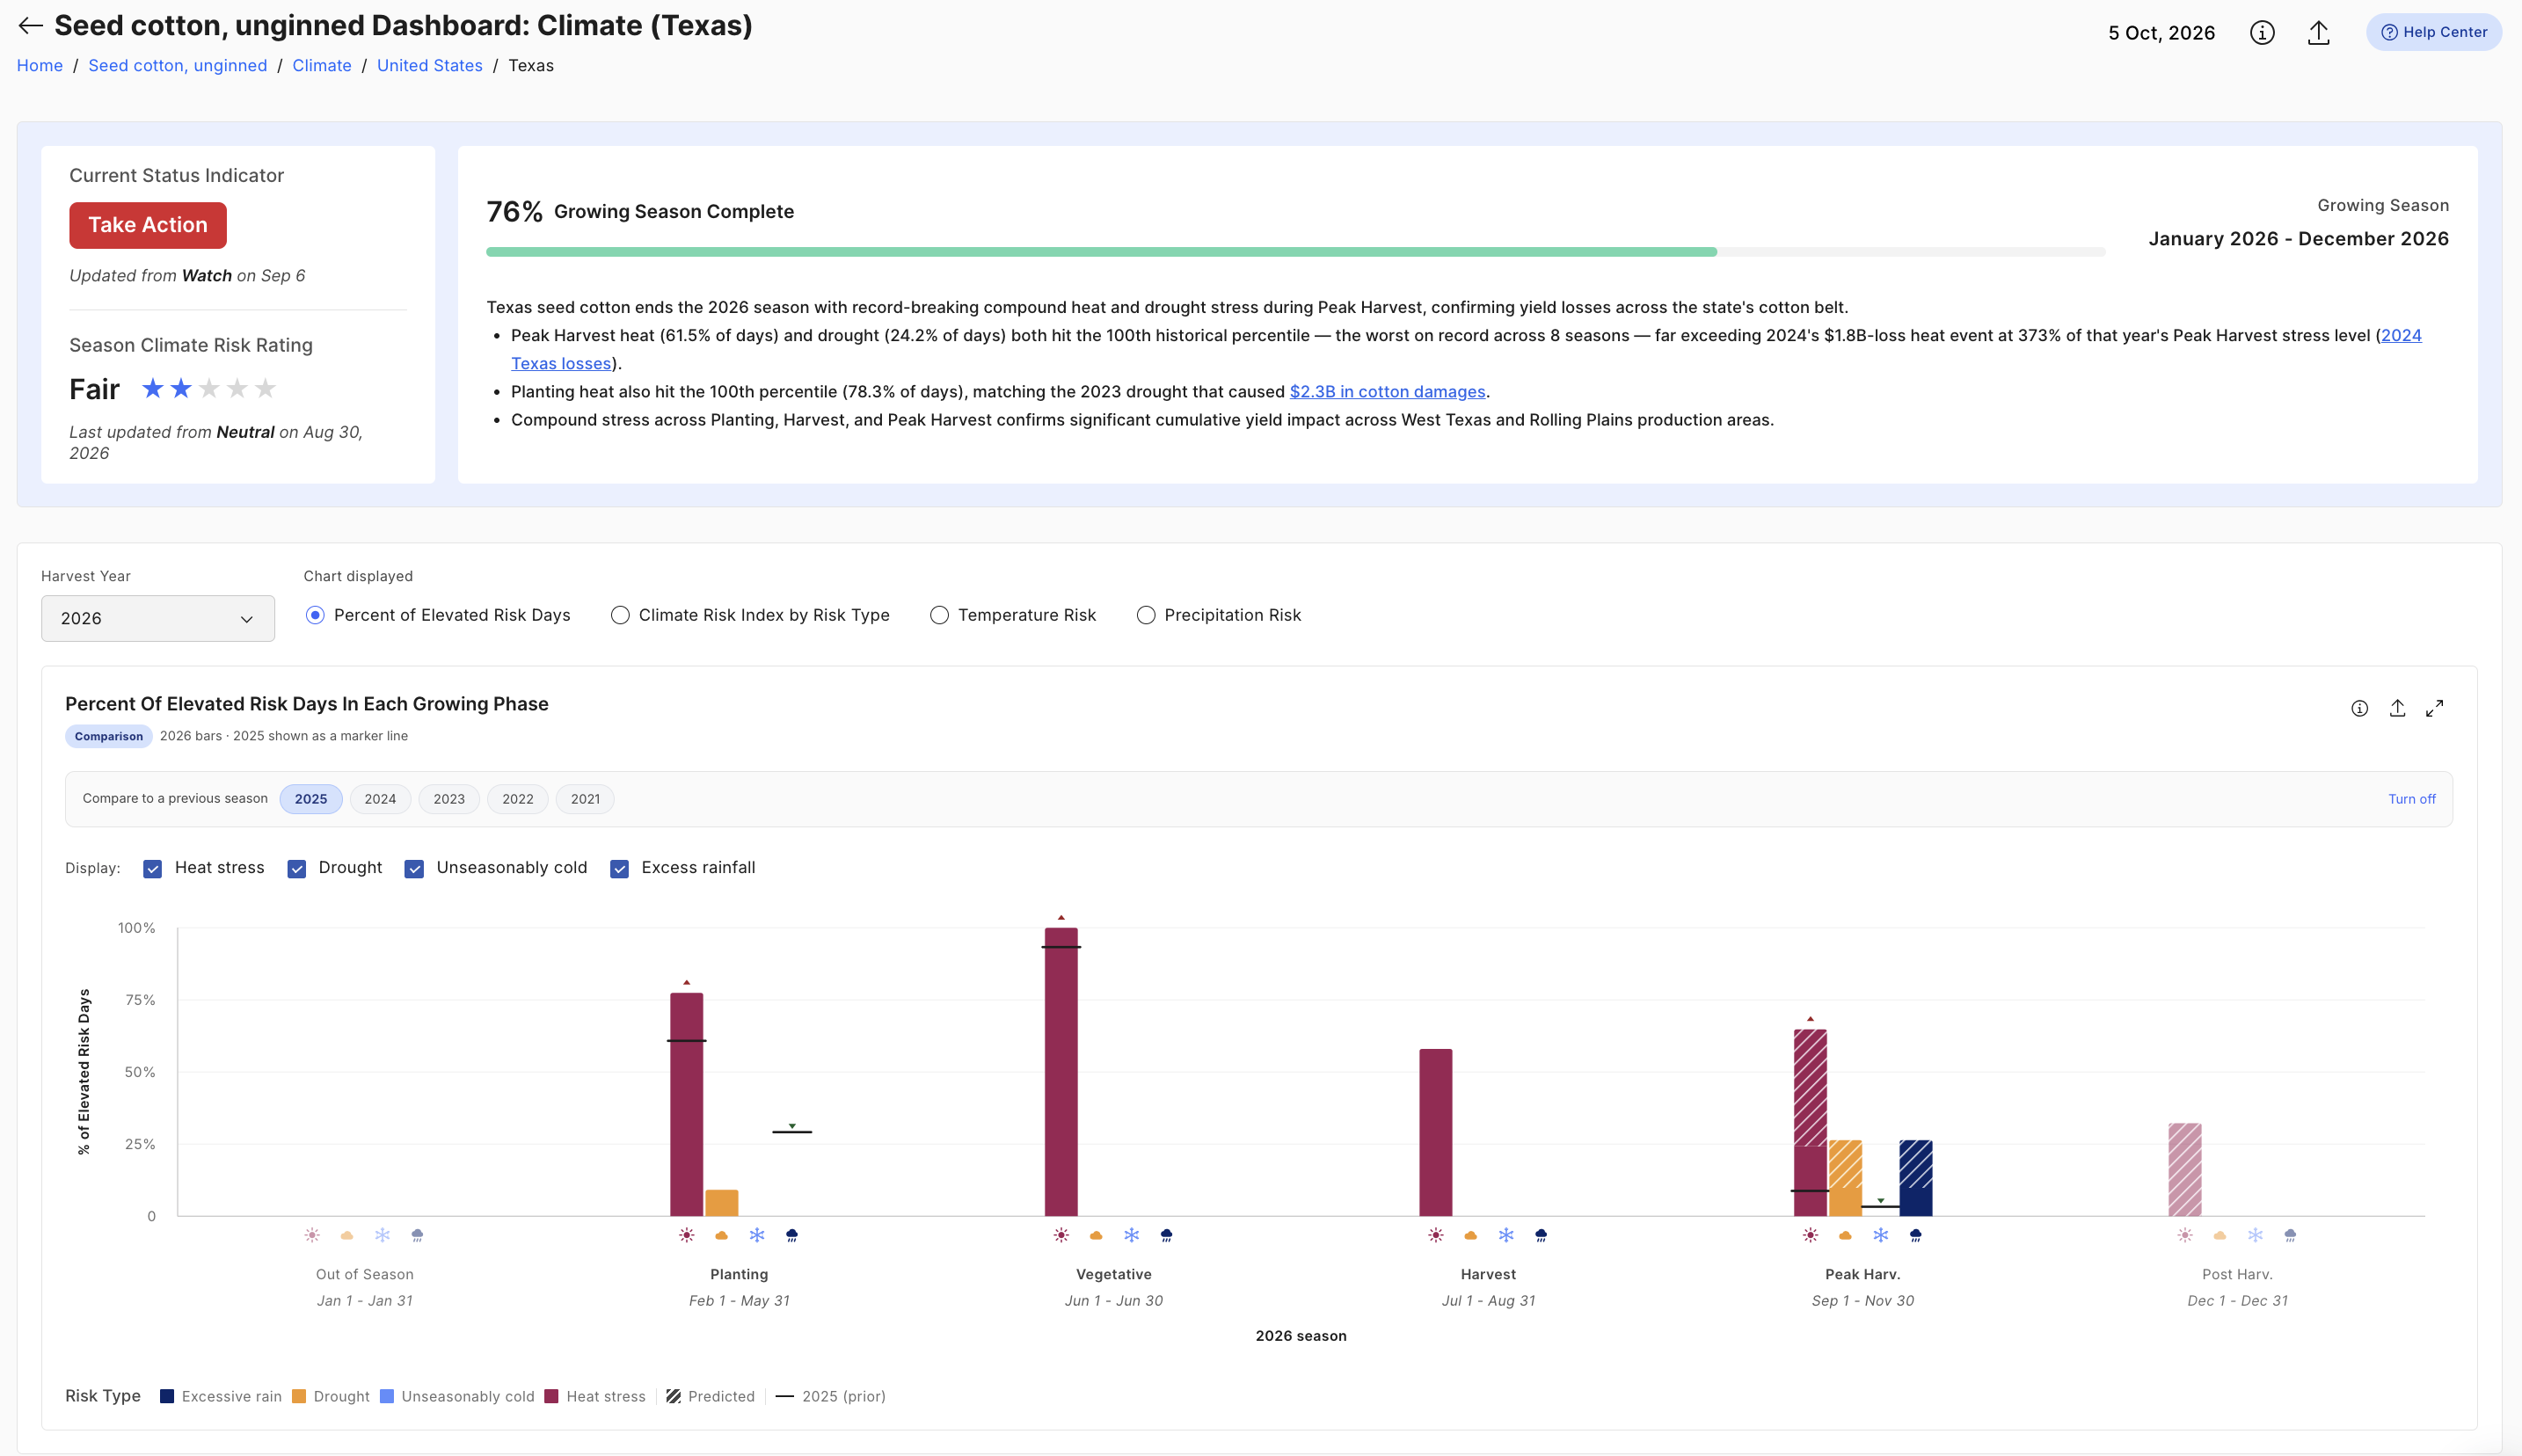
The headline index is less dramatic than those percentages suggest. The US WA%R runs between 9.7 and 20.5 through the window, below its normal range of 14.5 to 21.8. What changes is the driver. Heat accounts for 15.4 of the 19.7 points on 14 October, excess wet takes over with 13.5 of 17.1 on 23 October, and heat returns with 17.9 of 18.0 on 24 November. A harvest that bounces between heat stress and wet fields is harder to schedule than one with a single problem, even when the index total looks ordinary. The dashboard's own comparison is the 2024 Texas heat event that caused $1.8 billion in losses; this season's peak harvest readings exceed it.
What did this season do to Xinjiang?
Xinjiang grows 91% of China's cotton and has just come through a season with drought stress on 97% of grain fill days. The previous eight-season record was 39%. Heat in the same phase sat at the 50th percentile, which kept the region out of the most severe compound-stress tier but offers no yield recovery, and Horizon rates the crop likely 10 to 15% below trend. That is the single largest yield hit among the five producers. China as a whole is at Warning with a one-star Poor rating, and Shandong (2.2%) and Hebei (1.9%) are flagged Take Action at half a star, though together they grow only 4.1% of the national crop.
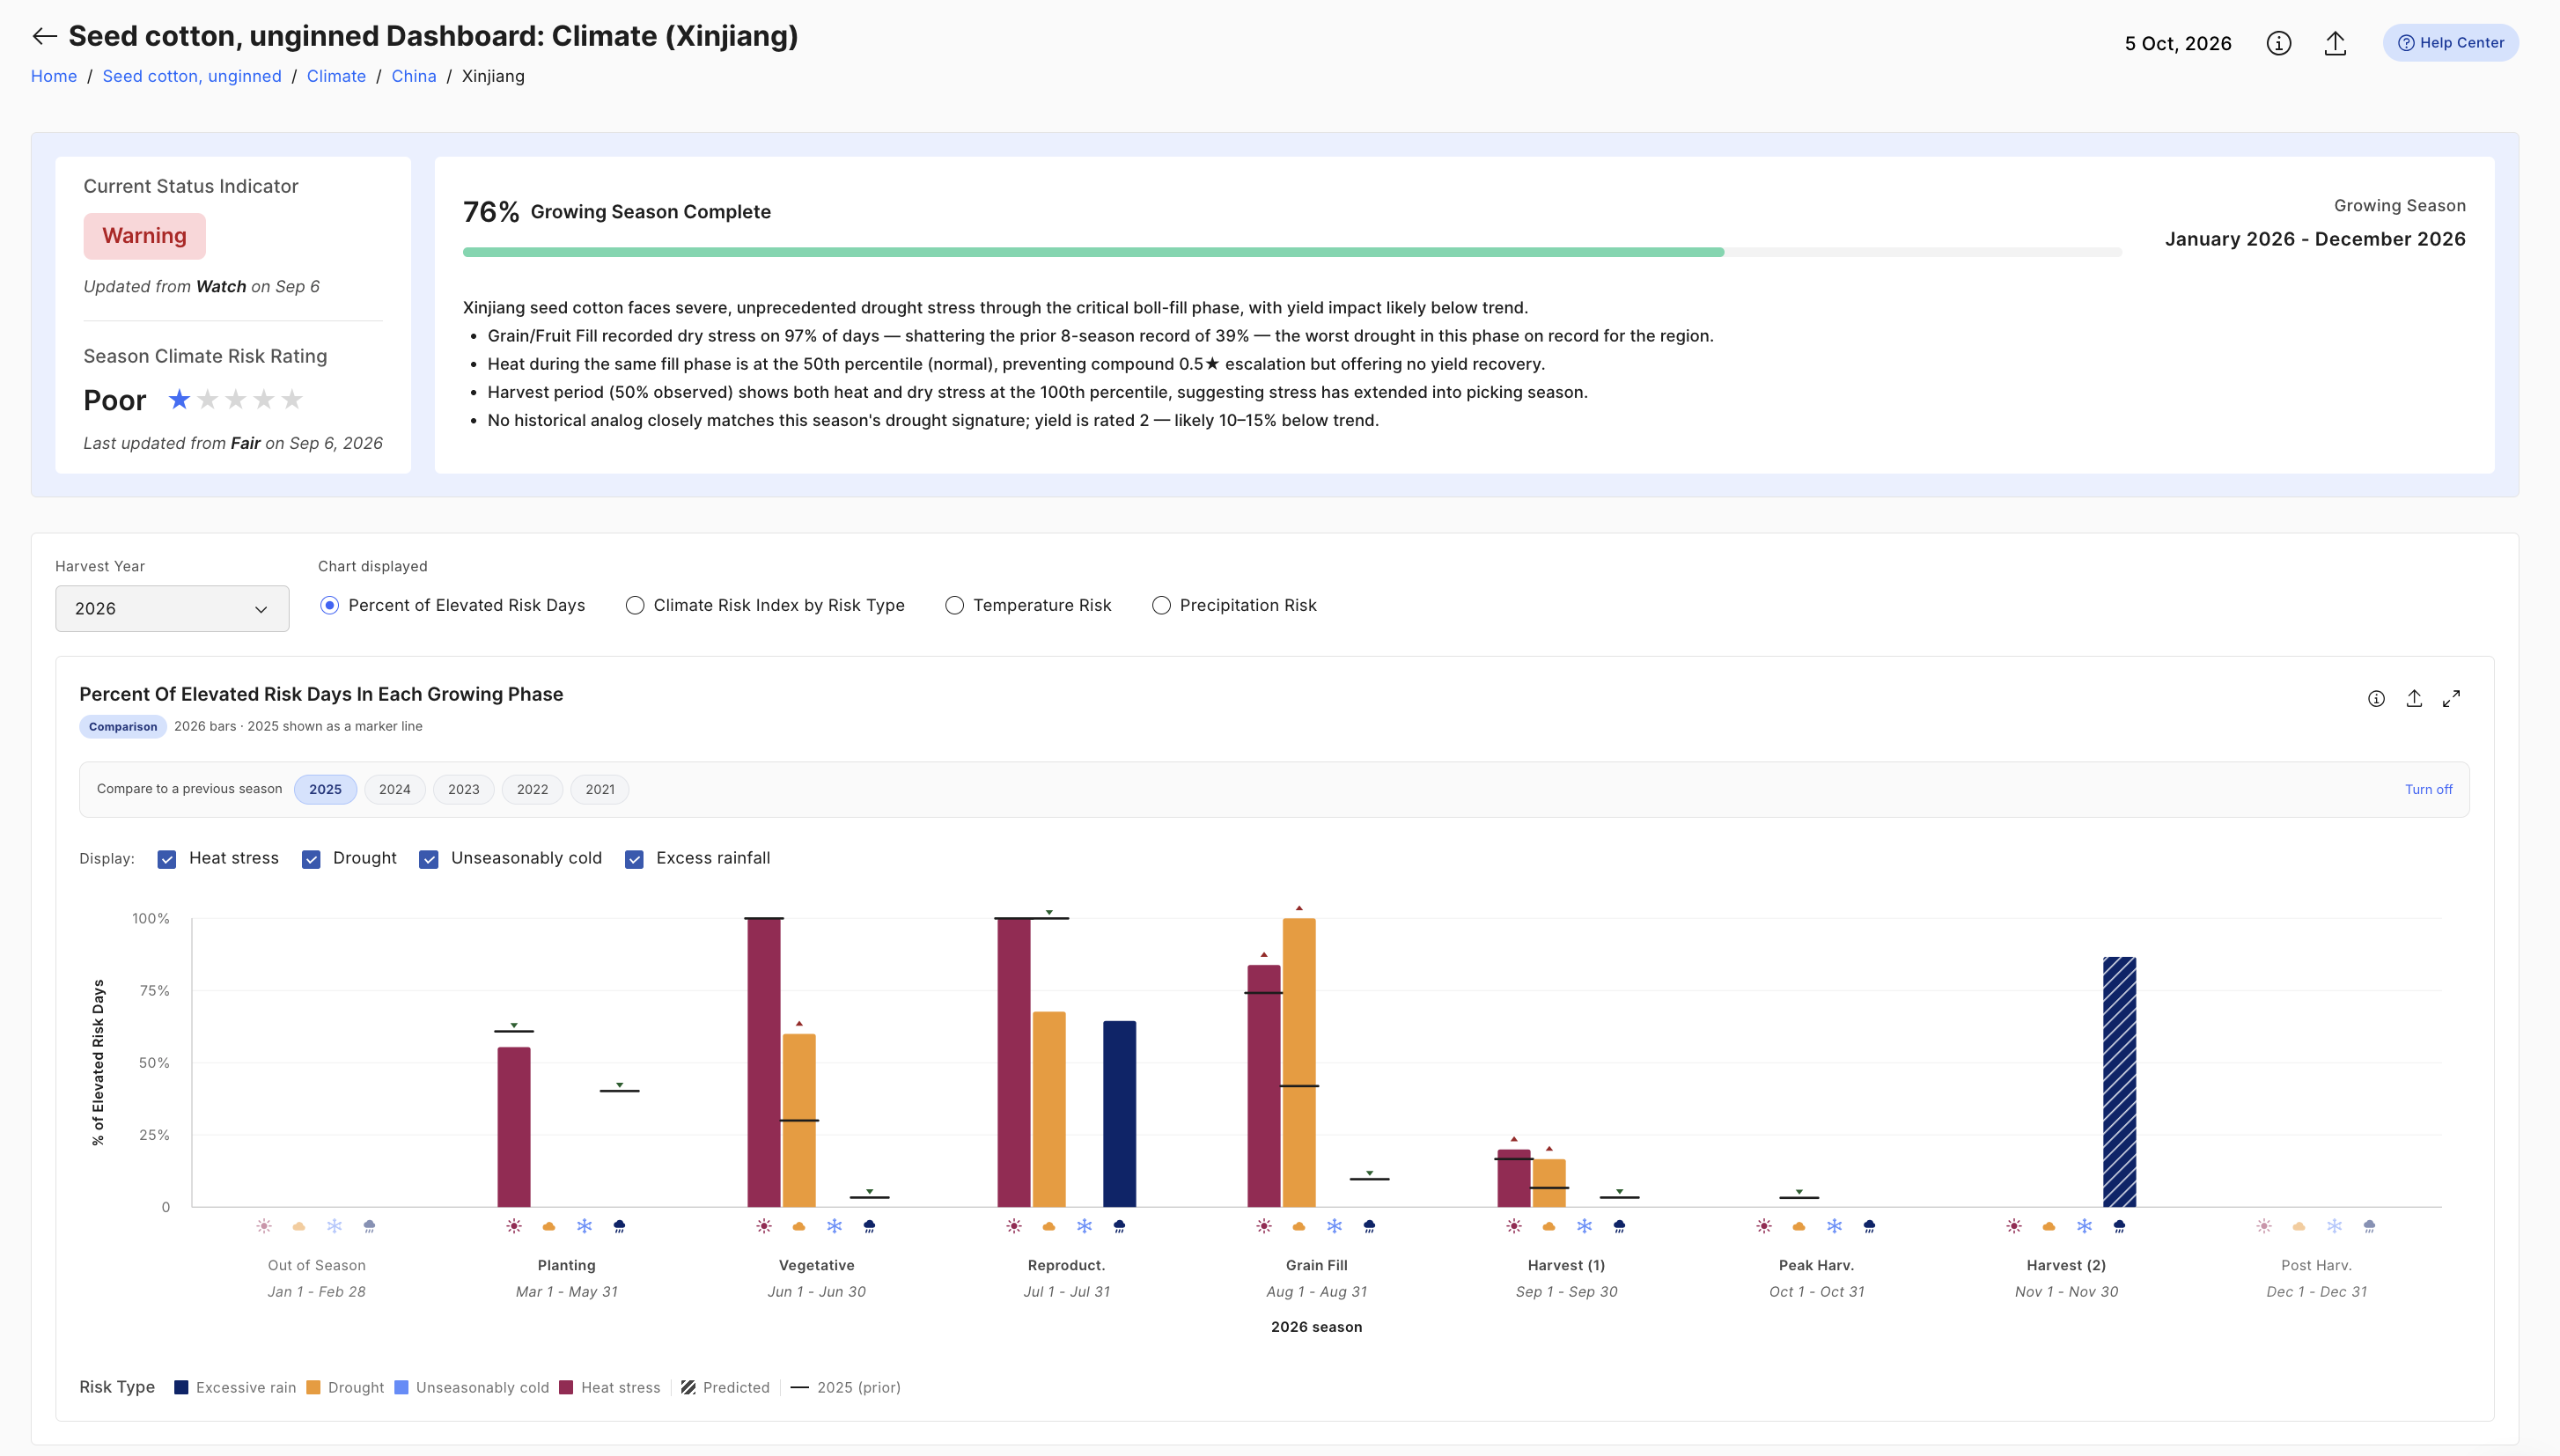
From November the problem reverses. China's index stays contained, between 5.8 and 19.3 and below its norm of 15 to 20 throughout, but the composition flips from dry-led in early October to almost entirely wet from November. On 8 November, 19.0 of the 19.2 points come from excess wet. For Xinjiang itself, Horizon forecasts excess rain on roughly 87% of days in the November harvest window and flags wet stress continuing into post-harvest. The yield is already set, so this is a drying and storage question rather than a crop one, but it is the wet reading Horizon credits for the December price recovery discussed below.
Why does Brazil's cotton risk land in early 2027?
Brazil is the quiet one this quarter because its 2027 crop is only just being planted. The index through November runs between 2.1 and 11.3 against a norm of 7.6 to 10.4, fading to about 2 by late in the month, and the country is rated Neutral at three stars.
The exposure shows up in the first quarter. Horizon forecasts 86.4% wet days during vegetative growth in January and February and 100% wet days during reproductive development in March, the two phases that set yield. Mato Grosso, which grows 70% of Brazil's cotton, also carries 63% forecast wet stress through grain fill in April and May. If those forecasts hold, Brazil moves from the calmest producer on this list to the one with the most yield at stake, and it does so after the Northern Hemisphere harvests are already priced.
Where are cotton prices heading?
Helios Horizon expects cotton to fall about 10% over the next month and then claw most of it back by December. The platform prices cotton as an export series on the China Grade 428 Index, FOB China ports. The current print is $2,644 a tonne for the week of 28 September, updated 2 October. That is about 4% below the $2,756 of a month earlier and roughly 22% above the $2,161 of a year ago. Three months back the series was at $2,629 and six months back at $2,464, so the past half year has been a slow grind higher with a recent wobble.
The forecast path is the interesting part. One month out the model has $2,383 a tonne, down 9.9%. Three months out it is $2,547, six months $2,532 and twelve months $2,562, so every horizon beyond the first sits 3 to 4% below today. The monthly path explains why. October averages near $2,370, an 11.5% drop from September's $2,680 as peak harvest supply from the Northern Hemisphere arrives at once. November stays flat around $2,380. December then recovers to about $2,540, and the curve drifts toward a period high near $2,570 by October 2027.
The platform attributes that December recovery specifically to the excess-rain risk flagged in the sections above. The pieces line up in sequence: harvest pressure drives the October low, Pakistan's wet harvest peaks in mid-November, and China's wet harvest and post-harvest forecast is what pulls the curve back up. For a buyer, the practical reading is that October looks like the cheapest window in the forecast, and that the weather risk the model is pricing has not yet shown up in the cash price.
What should cotton buyers watch between now and March?
Three dates carry most of the risk. The week of 17 November is when Pakistan's harvest index peaks and the quality of the Punjab and Sindh crop gets decided. December is when Xinjiang's wet post-harvest forecast lands and when the price model turns back up. And March is when Brazil's reproductive development runs into a 100% wet-day forecast, with the yield of the 2027 crop in the balance.
None of these is visible in a price chart today. That is the point of tracking weather risk by growth stage rather than waiting for the market to react. If you buy cotton or cotton-based inputs and want these series at region level, with the daily temperature and rainfall readings behind the index, Helios Horizon tracks them for all five producers and down to individual states and provinces.

.png)

Personalized commodity intelligence for the teams that feed the world.
