
We Expected a Price Crisis. The Crisis Was in Who Could Pay.
The Strait of Hormuz closed at the start of March and we said it would produce a food crisis; six months on the FAO Food Price Index is up 6.2 percent, because four things absorbed the shock and not one of them refills.

September 17, 2026
3 min read
The Strait of Hormuz closed at the start of March and we said it would produce a food crisis; six months on the FAO Food Price Index is up 6.2 percent, because four things absorbed the shock and not one of them refills.
By João Pedro Rodrigues Morciani · Senior Analyst, Helios AI
In March We Expected a Food Crisis. The Price Move Was Single Digit.
In March we said a Persian Gulf war would produce a food crisis. So did most of the market.
The Strait of Hormuz closed to commercial traffic at the end of February 2026 and the closure was confirmed publicly on 2 March, on Al Jazeera’s reporting. It has not reopened, and it was still shut to commercial shipping in mid-September.
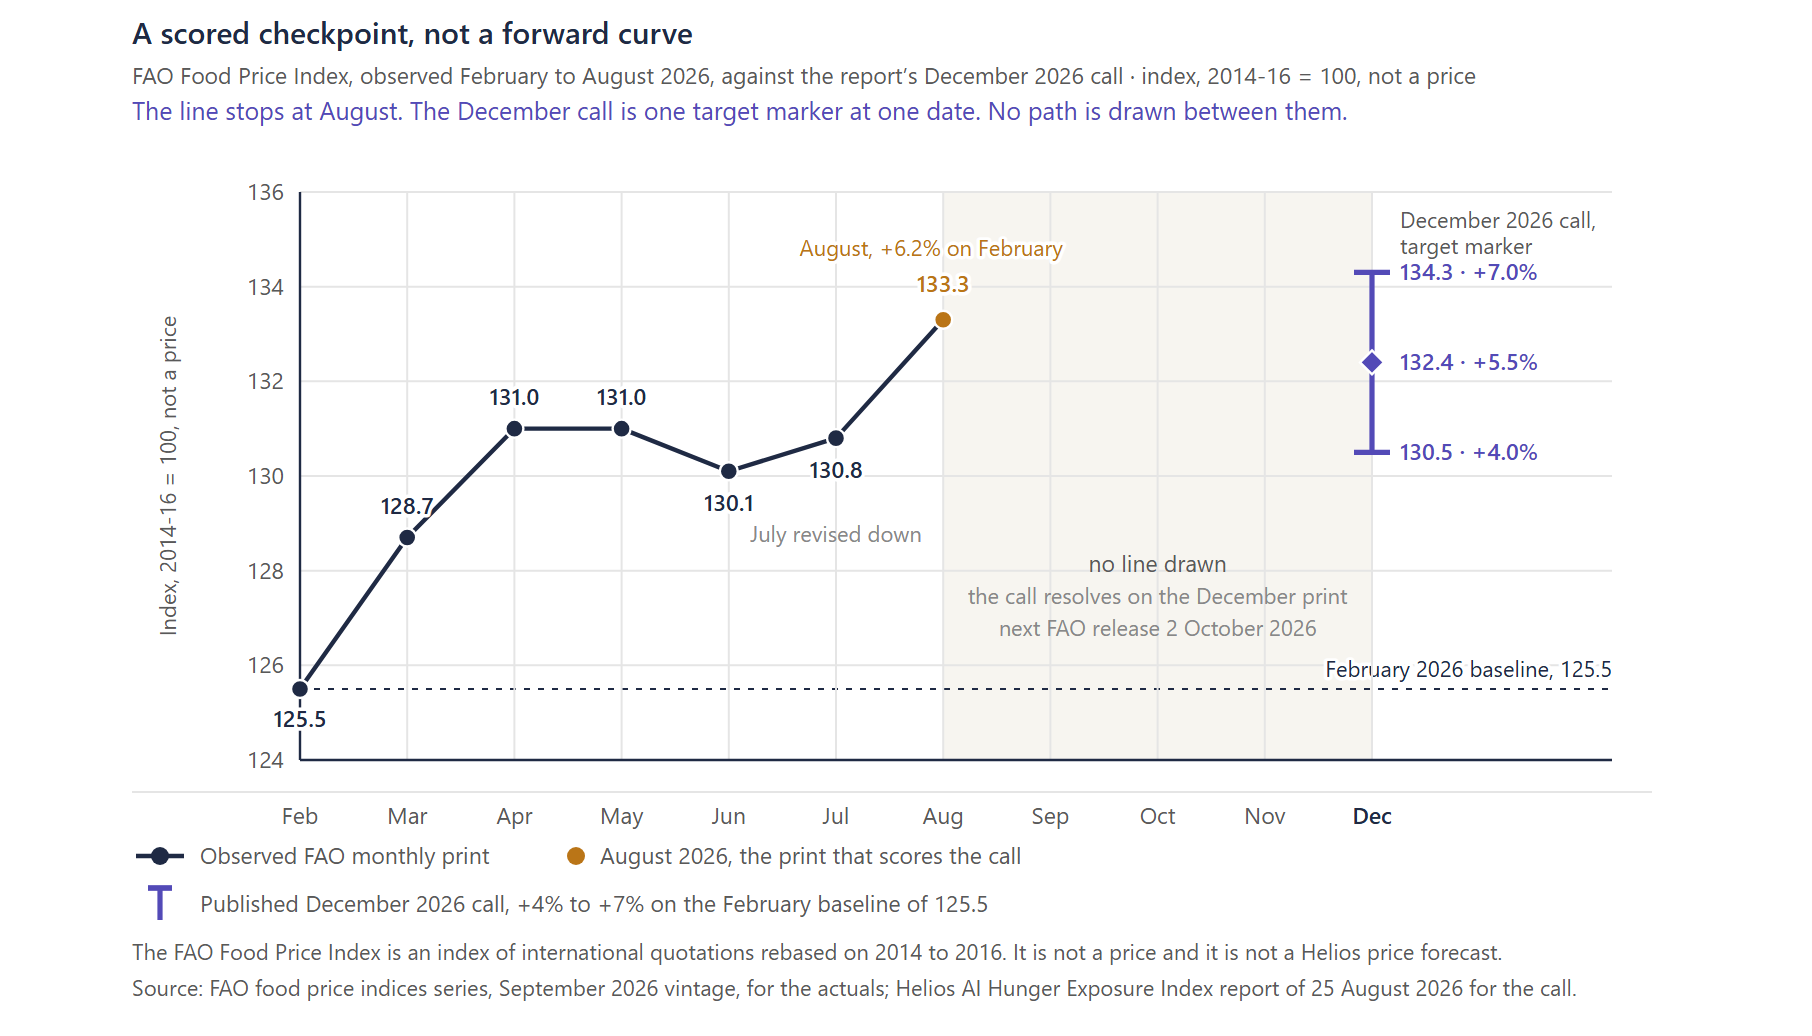
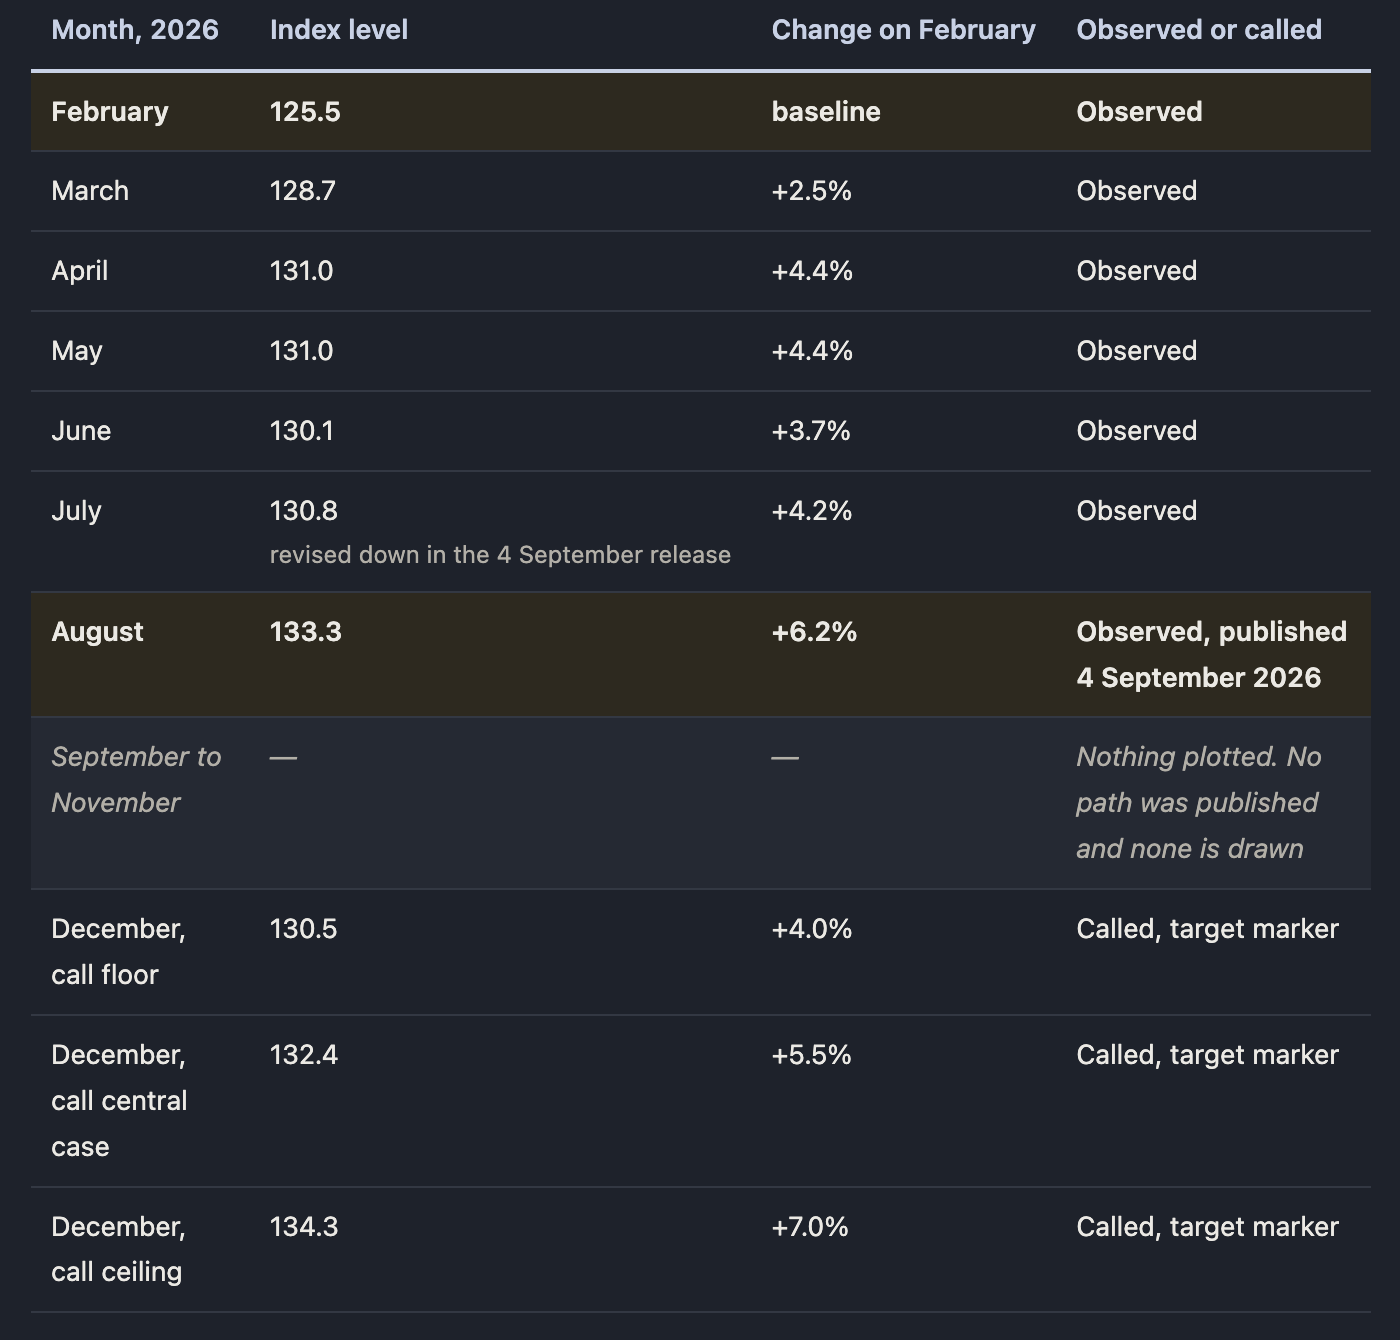
Six months of prices are now in. The FAO Food Price Index stood at 125.5 in February 2026, the last reading before the closure, and 133.3 in August, published on 4 September. That is 6.2 percent. FAO revised its July figure down to 130.8 in the same release. The index tracks international quotations rebased on 2014 to 2016 and it is not a price.
Four Things Absorbed It.
The absorption was real, and most of it had already happened before the strait closed.
The crops that fed the first half of 2026 were grown and fertilized in 2025: a record 432 million tonnes of United States corn on USDA’s final January 2026 estimate, 180.6 million tonnes of Brazilian soybeans on CONAB’s tenth survey of July 2026, and a record 70.5 million tonnes of Argentine corn on the Rosario exchange’s count. Energy eased, with Brent at $118 a barrel at the close of the first quarter on the US Energy Information Administration’s 7 April reading, $72.68 prompt-month on 25 June and near $87 on 25 August. Ports outside the strait took the diverted cargo, Jeddah and Yanbu on the Red Sea and Salalah in Oman, on CNN’s reporting of 24 March. And the Black Sea supplied everyone outside the Gulf until its export route closed in July. None of those four is ours to forecast. They are inputs the index reads, and crops are what we cover.
None of Them Renews.
Stockpiles do not refill themselves and a record harvest is one harvest: FAO cut its 2026 world cereal forecast to 2,980 million tonnes on 4 September, 61.1 million below 2025. The Black Sea leg has gone and Brent is back near $87. On top of that sits a forecast, with NOAA’s Climate Prediction Center putting Niño-3.4 at plus 1.8 degrees Celsius in August 2026, in its 10 September discussion, and the peak in the last quarter of the year.
Which leaves what the last twelve months proved. World cereal production reached roughly 3,040 million tonnes in 2025, the largest on record, on FAO’s brief of 4 September 2026. In the same year 266 million people were in acute food insecurity at Phase 3 or above, on the Global Report on Food Crises 2026 of 24 April, which records conflict rather than weather as the leading driver overall. Both are correct and they do not cancel. There was enough grain. Reaching the people who needed it was a purchase, and the purchase needed foreign exchange. Our report puts it in one line: “Availability was not the constraint, the ability to pay for imports was.”
So the map worth having is a map of buffers.
Severity Is a Count. Exposure Is a Ratio.
Most food-security rankings measure how many people are hungry now. That is severity, and exposure is a different variable.
Exposure is what happens when the next shock arrives: the size of the shock set against the buffer underneath it. A country can carry a very large caseload and still absorb a failed harvest if it can buy the difference on the world market. One with a smaller caseload and a month of foreign-exchange cover cannot.
The index scores 47 countries on that basis: 6 Critical, 32 Elevated, 9 Monitor. Everywhere else renders grey, and grey is unscored rather than safe. It means a pillar input is missing, or that no documented ENSO teleconnection exists for that country in the coming season. This is not a complete ranking of the world and we do not publish it as one.
Nigeria Ranks 47th of 47.
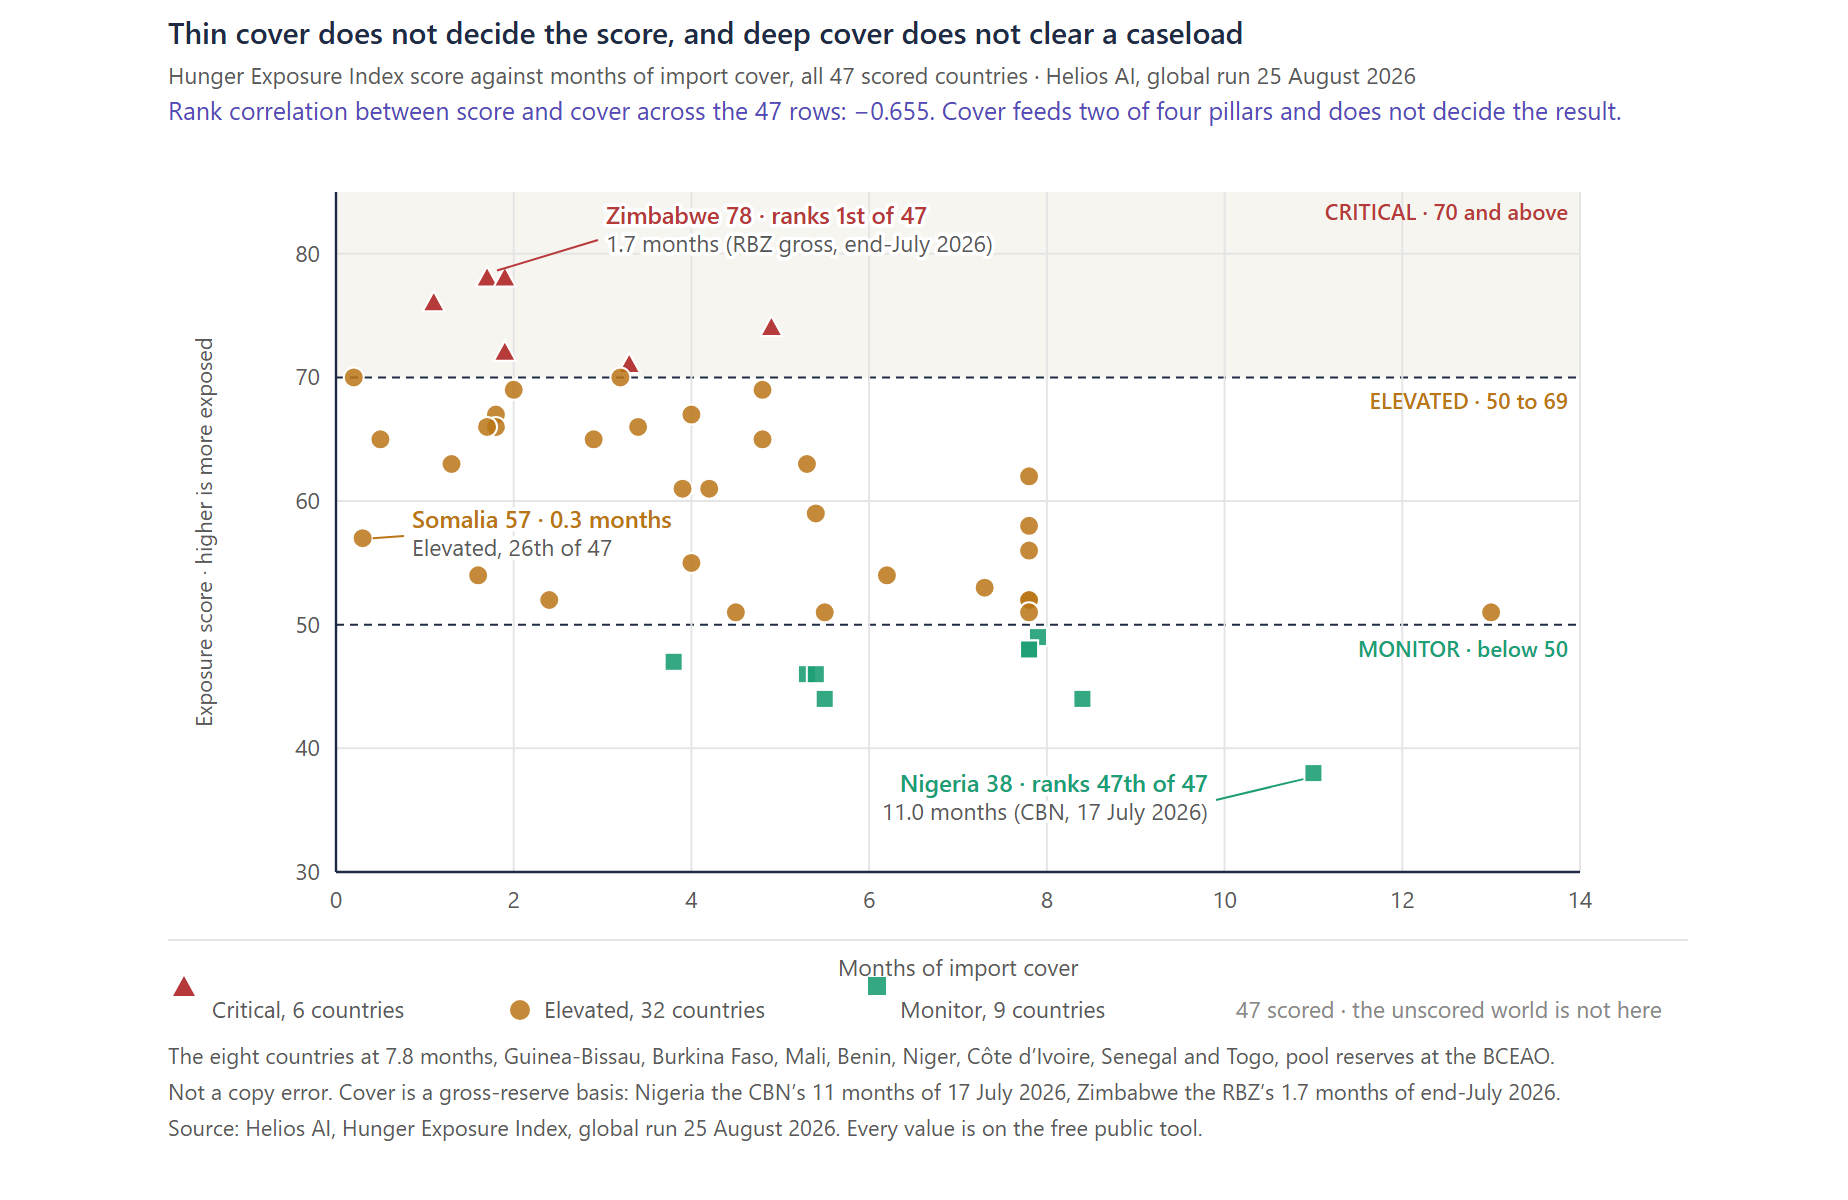
Nigeria carries one of the largest hunger caseloads in the world and is the least exposed country on the index.
It scores 38, sits in the Monitor tier and finishes last of the 47. Its crisis is conflict-driven and domestically supplied rather than import-driven, it exports fertilizer rather than importing it, and it holds deep cover: Governor Cardoso of the Central Bank of Nigeria put gross reserves at USD 52.52 billion and import cover at 11 months on 17 July 2026.
A list ordered by severity puts Nigeria near the front of the queue. A list ordered by exposure puts it last. Both lists are needed, and they are not the same list.
No Single Pillar Is the Index.
The buffer is a composite of four weighted pillars, and none is the index on its own.
Climate exposure of the cropping calendar carries 30 percent. Fertilizer and energy routing carries 25, the foreign-exchange constraint 25, and import dependence set against hunger severity the remaining 20. Months of import cover feeds two of those pillars and does not decide the result. Across all 47 rows the rank correlation between a country’s score and its months of cover is −0.655, and Somalia, at 0.3 months, ranks 26th in the Elevated tier rather than Critical.
Most of what it consumes is public, and the full input list is in the FAQ below. Our own climate-risk index and yield model are two of those inputs. Fertilizer, energy and shipping are things the index reads rather than commodities we cover. We cover crops.
The pillar with our name on it is the one we can measure least well, and the report’s appendix says so: “Our crop coverage is deepest in commercial and export agriculture, so for several fragile states in the exposure index the climate pillar rests on public seasonal outlooks rather than on our own measurements.” That is the heaviest of the four weights. The score it produces “measures exposure rather than outcome,” and a climate-risk score is never a harvest result.
A Good Year Does Not Rebuild a Buffer.
Malawi is in the Critical tier in the season its own harvest rose 14 percent.
The crop recovered and still came in roughly 200 thousand tonnes short of national requirement, with negative net reserves underneath it. Four of the six Critical-tier countries are in southern Africa, in that same recovery year. The region’s harvest came back. Its reserves did not.
Somalia is the other half of that year. FSNAU’s post-deyr assessment of 24 February 2026 puts southern Somalia’s 2025 deyr cereal production at 15,600 tonnes, 83 percent below the 1995 to 2024 average and the lowest since 1995, with 4.8 million people in Crisis or worse as of January 2026 and 6.5 million projected for February and March. That happened inside the record global harvest year.
Zimbabwe ranks first of the 47, level with Malawi on 78. Its cover is 1.7 months against the Reserve Bank of Zimbabwe’s gross reserves of USD 1.7 billion at end-July 2026, or 1.16 months on the IMF’s 2026 net projection, and the basis belongs in the sentence.
One Published Call Already Has a Print.
We published the index with dated forward calls attached, and one of them now has a first data point.
The August print landed inside the range the report gives for December 2026, plus 4 to 7 percent, and it landed in the upper half of it four months early. That is a waypoint and not a result. The call resolves on the December print rather than on any single month, and our own methods section names sharp price reversals as its main failure mode.
The Amplifier Is Strengthening. Strength Is Not Damage.
A strong El Niño is developing, and the second half of that sentence is the part worth acting on.
NOAA’s Climate Prediction Center kept an El Niño Advisory in force on 10 September 2026, with greater than 90 percent odds of a very strong event through the northern-hemisphere autumn and winter of 2026-27, and a 75 percent chance of a historic event exceeding every El Niño since 1950.
Strength is not damage. As we argued in July, a strong El Niño does not light up every book, and our own event history says the same: of 32 origin-crop pairs, 27 show no distinguishable relationship between the peak ocean anomaly and the production deviation, and Australian wheat’s rank correlation is +0.02. Five pairs do scale, palm oil among them, and that is a separate piece. CPC says it itself: “With an event of this magnitude, the chances of experiencing impacts consistent with El Niño are larger, though not guaranteed.”
The Bottom Line.
Exposure is knowable months in advance. The event is not.
Nobody can say today which origin this El Niño will hit. The 47-country table can say today which of your suppliers and destination markets could not buy their way out of a shortfall, and every value in it is published. The report’s own timing holds: the pre-positioning window closes around October. The next FAO print lands on 2 October 2026 and the index is next rebuilt on 15 January 2027.
The shock is a forecast. The buffer is a fact.
See the full 47-country ranking and the interactive map, free and ungated.
Frequently Asked Questions
What is the Hunger Exposure Index?
It is a Helios AI index that scores 47 countries on how badly a new food shock would hit them, rather than on how many people are hungry today. Each country is scored on four weighted pillars: climate exposure of the cropping calendar at 30 percent, fertilizer and energy routing exposure at 25, the foreign-exchange constraint at 25, and import dependence set against hunger severity at 20. The current run is dated 25 August 2026 and places 6 countries in the Critical tier, 32 in Elevated and 9 in Monitor. Most inputs are public, including USDA FAS PSD, FAO food balance sheets, FAOSTAT fertilizer trade, IPC and FEWS NET, and IMF and World Bank reserves data, so the scoring can be checked from outside. The full ranking and the map are free at heliosai.com/tools/hunger-exposure-index, and the index is next rebuilt on 15 January 2027.
How is hunger exposure different from hunger severity?
Severity is how many people are in acute food insecurity now, which is what IPC and CH phase classifications measure. Exposure is what happens to a country when the next shock arrives, which is a function of the shock and the buffer underneath it. The two rank countries differently and they answer different questions. In 2025, 266 million people were in acute food insecurity at Phase 3 or above while world cereal production set a record of roughly 3,040 million tonnes, which is the clearest evidence that global availability and national ability to pay are separate problems.
Why is Nigeria the least exposed country on the index?
Nigeria scores 38 and ranks 47th of 47, in the Monitor tier, despite carrying one of the largest hunger caseloads in the world. Its crisis is conflict-driven and domestically supplied rather than import-driven, it exports fertilizer rather than importing it, and it holds deep foreign-exchange cover. Governor Cardoso of the Central Bank of Nigeria put gross reserves at USD 52.52 billion and import cover at 11 months on 17 July 2026. A low exposure score is not a statement that Nigeria’s hunger caseload is small. It is a statement that a further import shock is less likely to be the thing that breaks it.
What is “months of import cover” and why does it matter?
It is a standard reserve-adequacy measure: foreign-exchange reserves divided by average monthly imports, published by the IMF, the World Bank and most central banks. It matters because buying food on the world market requires foreign currency, so it sets how much of a harvest shortfall a country can replace by purchase. It is not the whole index. Across the 47 scored countries the rank correlation between score and cover is −0.655, and Somalia, with 0.3 months of cover, ranks 26th rather than in the Critical tier. Any published cover figure should carry its basis, because gross and net reserves give different answers for the same country.
Which countries are in the Critical tier?
Six: Zimbabwe, Malawi, Sudan, Papua New Guinea, Eswatini and Zambia, on the 25 August 2026 run. Four of the six are in southern Africa, in a season when the region’s harvests recovered. Malawi’s crop rose 14 percent and still fell roughly 200 thousand tonnes short of national requirement, with negative net reserves underneath it. Import cover across the Critical tier runs from roughly one month to 4.9 months, which is why the tier is not a ranking of reserve thinness on its own.
Where can the index’s forward calls be checked?
Each call in the report carries a date and a public checkpoint, which is the point of dating them. One has a first print already: against the February 2026 baseline of 125.5, the FAO Food Price Index reached 133.3 in August 2026, published 4 September, which is 6.2 percent above the baseline and inside the published range of plus 4 to 7 percent by December 2026. That call resolves on the December print rather than on a waypoint, and the FAO index is an index rebased on 2014 to 2016, not a price. The next FAO release is 2 October 2026.

.png)

Personalized commodity intelligence for the teams that feed the world.
